- Launch Services
Overview
Chart your path to success with specialized services.Implementation Project Management
Experts to ensure you launch on time and under budget.Solution Architecture
Seasoned advisors to help you best design your store.Data Migration & Optimization
Expertise on a clean and clear path to migrating your data.Enterprise Launch Package
Personal training on how to set up and launch your BigCommerce Store.

Professional Services Blog Series
Get to know our teams and how they support your success in this Q&A series.

The Global B2B Buyer Behavior Report
This in-depth report provides actionable strategies to help you sell more online.
A Comprehensive Guide to Data Quality Management

Create your store and start selling today.
Create your new website.
See if the BigCommerce platform is a good fit for your business.
No credit card required.

Written by
Jenna BunnellIn 1985, Coca-Cola released a new version of their iconic Coca-Cola drink. They called it “New Coke”.
All the data that Coca-Cola had collected suggested that New Coke would be a great success. They ran multiple taste tests, focus groups, and surveys and concluded that customers preferred the sweeter taste of New Coke. When announcing the new product, the director of Coca-Cola said, “I’ve never been as confident about a decision as I am about the one we’re announcing today.”
Strong words. Unfortunately, the release of New Coke is often considered one of the greatest business failures of all time. Consumers hated the new branding and Coca-Cola was regularly mocked for the introduction of New Coke.
Why did this happen when the data suggested that customers would prefer New Coke to the original formula?
The answer comes down to poor data quality. The only thing that Coca-Cola collected data regarding was the taste of New Coke, but this isn’t the only thing that consumers care about.
Branding is vital to Coca-Cola’s success – it’s why so many consumers buy their drinks over cheaper cola brands. The data collected about New Coke was not high quality as it did not accurately answer the question: will customers be happy buying New Coke rather than “Old Coke”?
Ensuring that your data is high quality is vital to many aspects of your business. From customer relations to predicting product trends, more and more companies are relying on data for decision-making. For example, a study by McKinsey & Company suggests that data-driven companies are 23 times better at acquiring new customers.
The New Coke story reminds us that before you use data to launch an exciting new product or initiative (and kick off the virtual celebrations), ensuring the quality of data is up to scratch is a must. This is why we’re providing this comprehensive guide to data quality management.
We’ll try and answer the following questions:
What is data quality?
What are the different types of data quality?
What are the dimensions of data quality?
How does data quality management work?
What is data quality management?
What is Data Quality?
Data quality is the measure of how accurate and useful a set of data is. The exact definition of data quality will vary depending on the data types being used and what they are being used for. Any business using data will want to ensure that the data is high quality, correct, and useful.
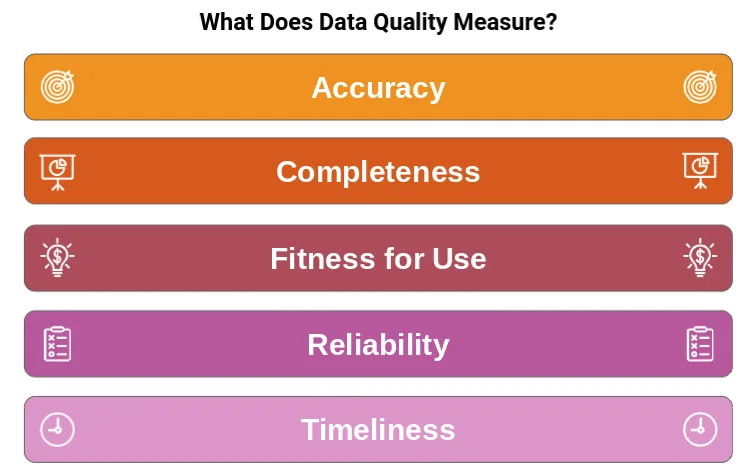
So, what does data quality measure? Ensuring that your data is high quality means you can be more certain it meets the following requirements:
Accuracy – is the data correct in its entirety and is each entry have unique? Are there mistakes and/or duplicate data?
Completeness – is all of the necessary data available or is some of it missing?
Fitness for Use – does the data provide the information needed for its purpose?
Reliability – is the data trustworthy and consistent? How does it compare to other reliable data?
Timeliness – is the data up-to-date?
These five factors determine the quality of a dataset and they are interrelated factors. For example, if the data is not accurate, it will not be fit for use. Or if the data is incomplete, it may not be reliable.
High-quality data is vital for businesses. Data contributes to business decisions at all levels – whether you’re deciding which products to launch each week or planning huge overhauls of your retail website. Recent research by Experian suggests that 57% of business owners are giving significant priority to improving their business’s data quality – higher than any other aspect of data management.
Types of Data Quality
Let’s dig a little deeper into the different types of data quality. The above five factors that contribute to the quality of data (accuracy, completeness, fitness for use, reliability, and timeliness) can be split into three categories that let us understand better how each of these factors contributes to the quality of a dataset. These are intrinsic, contextual, and representational data.
1. Intrinsic data quality.
In a research paper by Richard Wang and Diane M. Strong, the director of MIT’s data program and a professor of data science, respectively, the authors argue that intrinsic data quality “denotes that the data have quality in their own right”. Wang and Strong suggest that intrinsically robust data must be accurate, believable, reputable, and objective.
In short, intrinsic data quality is data that is high quality on its own, regardless of other factors such as when it was gathered or how useful it is.
Example: A beauty ecommerce company is preparing its next marketing campaign. To do so, the company draws on their customer data to collect the email addresses of previous customers. This data is stored carefully and for the marketing campaign to be effectively delivered to customers’ inboxes, there must be no intrinsic data quality issues.
2. Contextual data quality.
While an inherently robust dataset is very important, we must also remember that data always has a context. The context of customer email address data isn’t as important as the data accuracy, but if customer data is being used to assess the previous quarter’s sales, ecommerce businesses must bear its contexts in mind.
What is the data being collected for and how complete is the data? This is where factors such as completeness, timeliness, and fitness for purpose come in to play.
For data to be contextually high quality, it must be relevant to the data consumer. Even if the data is very accurate, if it was gathered too long ago or is incomplete, it will have little use to, for example, a brand wishing to understand recent consumer trends.
Example: A beauty ecommerce company has just purchased a VoIP headset for each member of their call center. They want to see if customer satisfaction has improved since making the purchase. To do this, the company needs new data for it to be relevant. If all of the customer satisfaction data comes from before the headsets were purchased, it is of no use – even if the data itself is intrinsically great.
3. Representational data quality.
Representational data quality refers to the format of the data and how easy it is to understand. This is essential for any data that is to be presented to data consumers – be they customers, employees, partners, or stakeholders.
Example: A beauty ecommerce company has collected call center data to see if customer satisfaction has improved since they purchased VoIP headsets. Once the data has been collected, it must be easy to see the difference in customer satisfaction before and after the purchase. If this is not clear to the data consumers, the data does not have strong representational quality.
Data Quality Dimensions
Data quality dimensions describe the measures used for data quality assessment. If you want to know how the quality of your data stands up (or perhaps doesn’t), it’s important to have quantifiable measures in place.
1. Data integrity.
Data integrity refers to whether or not the data has been collected, stored, and disseminated objectively. This means that those dealing with the data have done so impartially, ethically and that their methods are fully transparent to those consuming the data.
Example: A technology ecommerce business like Skullcandy is deciding whether or not to invest in better business communication tools. To do so, they need to assess employee data, such as an employee satisfaction survey, to make the best decision. It is important that this data has integrity and has been collected objectively for Skullcandy to make an informed decision.
2. Methodological soundness.
Data quality is also measured by the methodological soundness of how it has been collected, stored, and distributed. This refers to whether or not the methods used follow the standard business methods and data quality rules for collecting such data.
Example: Skullcandy wants to figure out what age demographic they should be focusing on, they may want to use customer data to discover the average age of their customers.
A methodologically sound dataset could be collected by asking online customers to enter their date of birth when checking out. It would not methodologically sound, however, to guess the customer’s age based on, for example, where they live.
3. Precision and consistency.
The precision and consistency of a dataset refer to whether or not the data is correct and consistent across all datasets.
Example: Skullcandy has a payment system and a CRM (Customer Relationship Management) system – both of which collect customer data. Precision and consistency can be measured by how accurate the data in these systems is (for example, are customer names correct?) and how consistent it is (is the name of each customer identical in both systems?)
4. Serviceability and relevance.
Whether or not the data elements are relevant and serviceable (i.e. useful) is another important dimension of data quality. This refers to factors such as timeliness and fitness for use.
Example: Skullcandy wants to know the average handle time in their customer service center. If the data was gathered ten years ago or refers to only one communication channel, it will not be relevant or serviceable if Skullcandy wants to use this data to streamline handle time.
5. Accessibility of data.
How easy is it to access, read, and understand the data available? This is what data accessibility measures.
Example: Skullcandy wants to know how much their average customer spends in their online shop. They ship to customers around the world, so deal in a variety of different currencies. If the data includes every currency that customers use, from Euro to Yen, the data will not be easy to understand. However, if the data is then converted into US dollars, it will be easy for the data consumers to see how much the average customer spends.
How Does Data Quality Management Work?
What is data quality management? Data quality management refers to specific processes and data analytics that will improve data quality, prevent problems with data, and ultimately make the data fit for use.
Effective data quality management covers all the bases. It starts with how the data is gathered and goes all the way to how it is used.
Before deciding which data quality management approach is best for you, it is helpful to identify the potential causes of low-quality data that you are looking to prevent or remedy. One study shows that 58% of organizations blame the quality data entries made by staff for bad data. This is closely followed by data that has been migrated or converted (such as if you changed systems and data was lost) and having multiple members of staff inputting data, creating inconsistencies.
If you can identify the root cause of any poor-quality data you have, it will save you time and money in the long run.
Let’s move on to the different types of data quality management. Data quality management is not an “off the rack” process, but this guide will help you understand the difference between the various approaches and help you make an informed decision.
1. Data governance.
Data governance is a system in which you take control over how the data is collected, stored, disseminated, and used. This can be as simple as defining who has the authority to enter, edit, and use the data you hold. This is a core part of business intelligence as it often sits at the root of data quality.
Many employees may not even know if their company has data quality standards in place. If this is the case for your employees, it’s time to implement some data governance and training. This could come in the form of data stewards who take a lead role in implementing data governance policies.
Example: The lingerie company Natori wants to know why customers are returning items. They collect data by asking customers when they return an item to give the reason for the return.
To ensure that their data consistency and utility is good, Natori’s data stewards suggest that rather than asking customers to write down why they are returning an item, each return reason should have a code (e.g. 1 = Item too large, 2 = Item too small, 3 = Item is faulty). The code is inputted into the returns system rather than entering the customers’ verbatim reasons for returning an item. That way, when Natori wants to look at the data, they have a clear dataset.
2. Data cleansing.
Data cleansing is a type of data analysis in which inaccurate, duplicate or corrupt data is identified within a dataset. Ideally, data cleansing will also correct or remove all low-quality data. Forbes reported that 84% of CEOs are concerned with the quality of the data that contributes to their decision making – so data cleansing is an important process if you will soon be sharing data with your CEO or stakeholders and want to ensure that the data quality is robust.
Example: Natori wants to share data from their product catalog with their stakeholders but the catalog was created years ago and has not been consistently maintained. Natori has since created a new way of organizing their data, so they use data cleansing to identify parts of the data that are missing, and then a team inputs the correct data so that the dataset is complete, accurate, and can be shared with stakeholders.
3. Data profiling.
Data profiling is the process of reviewing data sources and identifying problems with their structure, content, and the relationship between data in the source. This is an important part of business processes if you have recently migrated or converted data and need to perform troubleshooting across big data. Here is some more explanation of the three types of data profiling.
Structure Discovery
Structure discovery ensures that the entire formatting of the dataset is correct.
Example: Natori has just migrated their customer data from a legacy system to a smarter data management software. During the migration process, however, some of the customer contact numbers did not copy over correctly and they do not contain enough digits. A structure discovery data quality tool will identify what percentage of phone numbers in the dataset have too few digits.
Content Discovery
Content discovery focuses on individual data entries and metrics to discover data records that are incorrect or incomplete.
Example: Natori has discovered that 20% of the phone numbers in their customer data system contain too few digits. Content discovery will identify which rows of data contain this error.
Relationship Discovery
Relationship discovery shows how data is related. It begins by assessing the metadata (data that gives information about other data) and identifies what data is contributing to the references between cells and the metadata tables.
Example: Natori is using the area codes of customer phone numbers to present where their customers are from. The customer phone number entries feed into a table that displays the percentage of customers from each area code. Relationship discovery will highlight what cells are related to this data and whether or not incorrect data is affecting this relationship.
4. Data matching.
Data matching is a process in which you compare two datasets to see if any of the data is identical. In ecommerce, there are two potential uses for data matching. The first is to identify duplicates within a business’s own datasets – an important task to ensure that the data is precise and relevant. The second is to use data matching to compare the business with competitors.
Example: Natori has seen a drop in sales in their sleepwear product. They collect new data from their competitors’ product catalogs and run data matching against their catalogs. This will identify matching products and allow Natori to compare their prices against their competitors.
5. Data quality reporting.
Data quality reporting is the practice of capturing and recording instances of poor-quality data – mistakes, inaccuracies, or inconsistent data.
This is an important part of data quality management as it will help you discover where mistakes are happening. Once you’ve located the mistakes, you can work towards data quality improvement.
Example: Natori has noticed a sudden change in the average first response time, a vital call center KPI. They can use data quality reporting to capture and record any mistakes or inconsistencies in the call center data and figure out if there is a problem in the call center or, instead, with the data.
6. Master data management.
Master data is the consistent and uniform set of data that describes the core entities of a business. It is often used for predicting trends and is regularly used when presenting data to partners of stakeholders. In ecommerce, this is often customer, product, employee, and vendor data. Master Data Management refers to applying the other data management approaches listed here to master data.
Example: Natori wants to compare customer age demographics with the popularity of certain products that have been recently released. Customer data and product data are both examples of master data, but this data must be up-to-date, accurate, and consistent for the data that compares the two to be relevant and fit for use.
7. Customer data integration.
Customer data integration is when you consolidate all of your customer data into one accessible, useful system. Performing customer data integration could also connect your customer data to other datasets you have, such as shipping, sales, marketing, or call center KPI data.
Example: Natori may collect customer data through sales, accounts, marketing, and through cloud communication tools, like a virtual customer service center. They wish to have a broader view of their customers – past, present, and future – and so they perform customer data integration to combine these datasets into one system.
8. Product information management.
Product information management allows you to collect and store your product data in one place. An effective product information management tool will let you view data for individual products, groups of products, and your entire product catalog.
Example: Natori has product data for their bras, underwear, and sleepwear. By collecting this data in one place, they can achieve data standardization and provide useful data to their partners and stakeholders about the entire product catalog whilst still being able to zoom in on individual products or categories.
9. Digital asset management.
Companies that use a digital asset management system can store all data relating to their digital assets in one centralized place. This allows companies to store, view, and share their digital assets with ease.
Example: Natori has a lot of digital assets – images, written content, videos, and designs, to name a few. Now that Natori is managing a remote team, easy access to this data is even more important. By managing their digital assets in one place, Natori can keep all of this data in one place, making it far fitter for use than if the data was spread across various datasets and software.
Why is Data Quality Management Important?
The above explanations of data quality management have given some examples of how ensuring you have high-quality data is important. But let’s examine why it is so important a little further.
Research by CIO Insight suggests that businesses that effectively use data see increased revenue, reduced costs, decreased time spent reconciling data, boosted confidence in their systems, and improved customer satisfaction.
Why does high-quality data produce these results? Here are some examples of how investing in data quality management can improve your business:
Increased revenue
An ecommerce business with accurate, complete, fit for use, reliable, and timely data will be able to use that data to boost revenue. This data can be used for everything from deciding when to launch products to ensuring customers return for future purchases.
Reduced costs
One way for ecommerce businesses to reduce costs is to use data to assess where money should be spent. For example, your business might be spending money on marketing campaigns across multiple channels. You could use sales and customer data to assess which channels are generated the most sales and focus your spending there rather than spreading it across ineffective channels.
Decrease in time spent reconciling data
If you and your employees are spending hours reconciling data across multiple data sources and platforms, a streamlined data quality management approach could save a lot of time. Using the data quality tools suggested above, such as customer data integration or data matching, will allow your company to quickly access, view, and make the most of data.
Boosted confidence in analytical systems
In 2020, one report suggested that over 70% of revenue leaders prioritize data management. Showing your customers, employees, partners, and stakeholders that you have strong data quality management is an increasingly vital task.
Improved customer satisfaction
From improving the usability of your website to improving call center handling times, there are many ways that effective data quality management can be used to increase customer satisfaction. Data can be used to give you a better view of customers, allowing you to market to them and serve them better.
Conclusion
In 2021, 87% of business leaders in a single study said that there has been an increased demand for data insights within their organizations. The desire for decisions based on data is on the rise, but we must not forget the story of New Coke.
Bad data can sometimes be worse than no data at all – but there are plenty of data management tools out there that can help you make the best data-driven decisions for you, and your business.